
Most business plan guides give you a blank template and a list of sections. What founders actually need is something different: a real sample they can study, adapt, and use as a benchmark for their own plan.
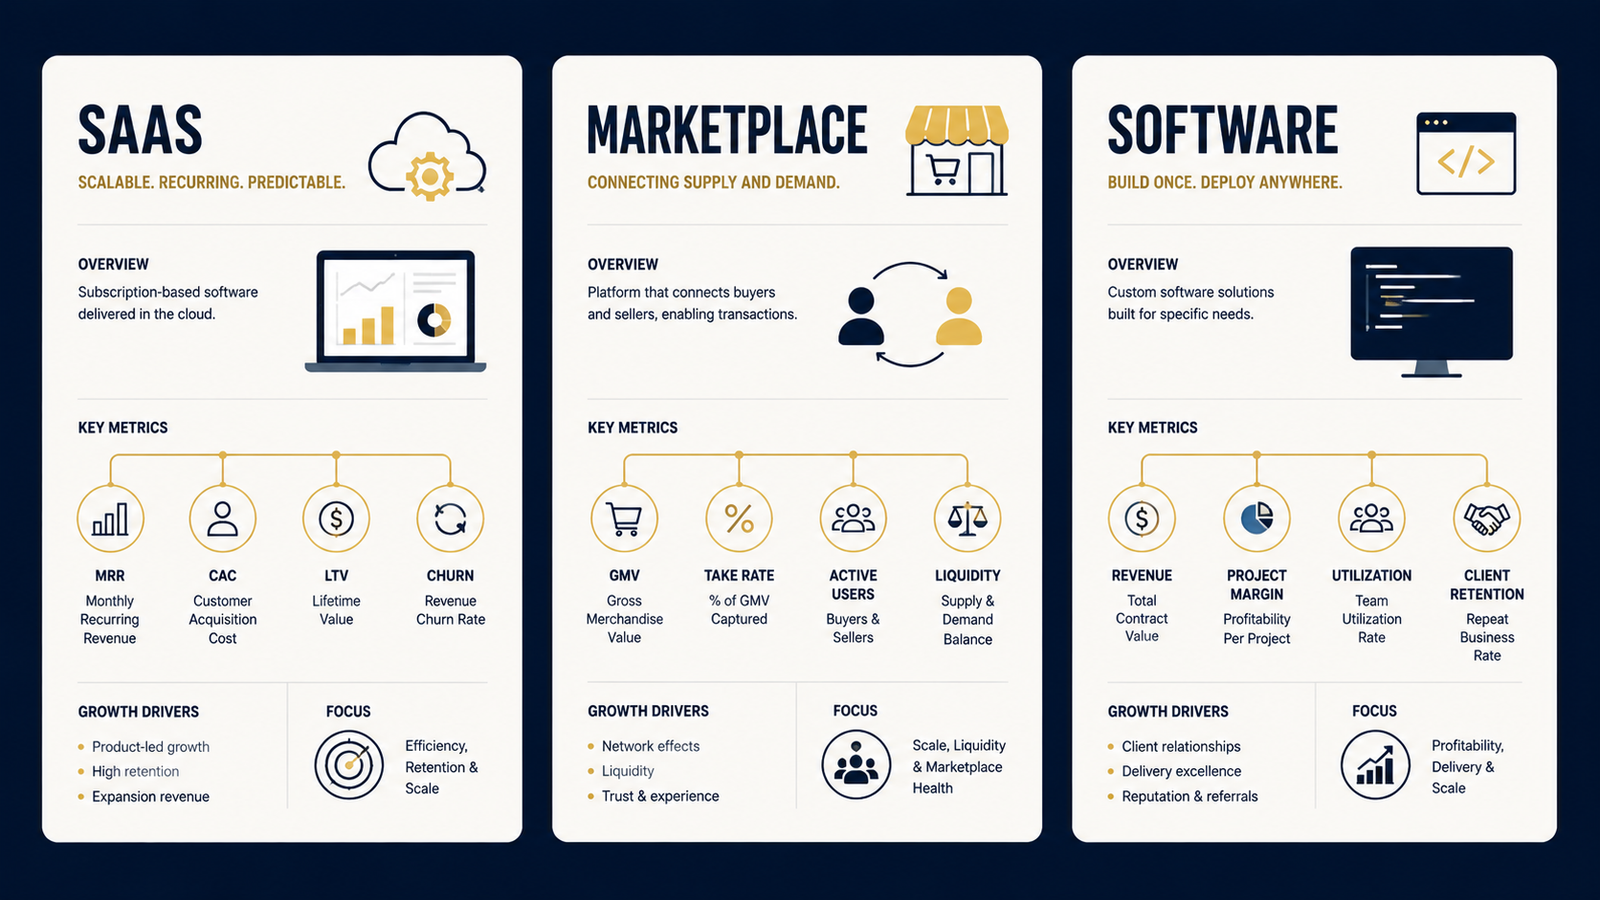
This guide provides three complete business plan samples — for an AI SaaS startup, a B2B marketplace, and a vertical software company — built around the structure and benchmarks that secured seed funding in 2026. Each sample includes the exact sections investors scrutinize most: executive summary, market analysis, business model, traction, financials, and use of funds.
The context matters. The startup funding market in 2026 is defined by a single word: bifurcation. AI-native startups are raising at speeds that recall the frothiest days of 2021, while everything else is operating in a disciplined market where SaaS companies need to show real revenue, consumer apps need to demonstrate retention, and fintech founders need to prove they understand regulation.
Against that backdrop, the business plans that work in 2026 are the ones that demonstrate genuine market understanding, realistic financial projections, and a specific articulation of why this team, in this market, at this moment — with this capital — will win.
The plans that secure funding distinguish themselves through depth of market understanding, realism about challenges, and clear articulation of how capital accelerates growth.
Here are three samples that illustrate exactly what that looks like.
What Investors Actually Look for in 2026
Before the samples, the benchmarks. In 2026, the median SaaS valuation multiple dropped from 7x ARR at the start of 2025 to 3.8x by March 2026. Top-tier companies still command 7–9x ARR, but merely being a SaaS business is no longer enough for premium valuations.
What seed investors require in 2026: a working product (not a prototype), early traction ($5K–$50K MRR for SaaS, 5–15 paying customers for enterprise), retention signals (logo retention above 85% for SaaS), founder-market fit, and a plausible path to Series A.
The financial metrics that matter most:
- Burn Multiple (net burn ÷ net new ARR): below 1.5x is good, below 1.0x is exceptional
- NRR (Net Revenue Retention): 120%+ is best-in-class
- CAC Payback Period: under 12 months for seed-stage
- Gross Margin: 75%+ for software businesses
- ARR per Employee: $500K+ signals capital efficiency
The best companies in 2026 are generating $0.50–$1.00+ in ARR per dollar of total funding.
With those benchmarks in mind, here are the three samples.
Sample 1: AI SaaS Startup — WorkflowAI
Fictional company based on real funded startup patterns
Executive Summary
Company: WorkflowAI Stage: Seed Raising: $2.5M Current ARR: $420K MoM Growth: 18% Gross Margin: 82%
WorkflowAI is an AI-powered workflow automation platform built specifically for mid-market professional services firms — accounting practices, consulting firms, and law offices with 20–200 employees.
Professional services firms spend 40% of billable hours on internal coordination: routing documents, chasing approvals, updating project statuses, and generating status reports. WorkflowAI eliminates this overhead using AI agents that understand firm-specific workflows and execute them autonomously.
We are not building a generic automation tool. We are building a system that learns each firm’s unique processes, client structures, and delivery workflows — creating a data moat that makes switching costs structural after 90 days of deployment.
Current traction: 28 paying customers, $15K average contract value, 94% logo retention at 6 months, zero paid marketing.
The ask: $2.5M to hire VP Sales, expand to 100 customers in 12 months, and reach $1.8M ARR — the threshold for a clean Series A.
Market Analysis
TAM: The global professional services software market is $47 billion, growing at 12% annually. The workflow automation segment specifically applicable to mid-market professional services is $8.2 billion.
SAM: Mid-market professional services firms (20–200 employees) in the US number approximately 180,000. At $12K average annual contract value, our serviceable addressable market is $2.1 billion.
SOM: In year 1, we target accounting and consulting firms in the US where we have domain expertise and existing customer referrals. Achievable market share at current growth rates: $12M ARR by year 3.
Why now: Generative AI has made it possible for the first time to build workflow systems that understand natural language instructions and adapt to firm-specific processes without custom engineering. Every competitor in this space was built before this capability existed. We are the only AI-native solution.
Target customer profile:
- Accounting or consulting firm, 30–150 employees
- $3M–$20M annual revenue
- Partners billing $200–$400/hour, frustrated by internal coordination overhead
- Currently using a combination of email, Slack, and spreadsheets for workflow management
- Paying $800–$2,000/month for fragmented point solutions that don’t talk to each other
Competition:
- Monday.com / Asana: General-purpose tools, not built for professional services workflows. Customers tell us they spend weeks customizing these tools and still don’t get the compliance documentation they need.
- Thomson Reuters / Wolters Kluwer: Legacy enterprise players. Expensive, slow to deploy, and not AI-native. Average implementation takes 6 months.
- Our moat: Proprietary training data from 28 deployed firms creates AI models that are materially better at professional services workflows than any general-purpose tool.
Business Model
Revenue model: Annual subscription, billed upfront.
| Tier | Price | Features | Target |
|---|---|---|---|
| Starter | $6,000/year | 5 workflow types, 10 users | Firms 20–50 employees |
| Professional | $15,000/year | Unlimited workflows, 50 users | Firms 50–150 employees |
| Enterprise | $30,000+/year | Custom AI training, unlimited | Firms 150+ employees |
Unit economics:
- Average Contract Value (ACV): $14,800
- Customer Acquisition Cost (CAC): $4,200 (primarily founder-led sales + referrals)
- CAC Payback Period: 3.4 months
- Gross Margin: 82%
- Estimated LTV (at 94% retention): $74,000
- LTV: CAC Ratio: 17.6x
Revenue model: We charge upfront annual subscriptions. This creates strong cash flow dynamics — we collect cash before we incur the cost of serving the customer.
Traction
- 28 paying customers acquired in 8 months
- $420K ARR ($35K MRR)
- 18% month-over-month growth (last 3 months average)
- 94% logo retention at 6-month cohort
- $0 paid marketing — 100% founder outreach and referrals
- NPS: 71 — measured across all paying customers
- 3 enterprise pilots in progress at firms with $25K+ ACV potential
Customer quote (CEO, 85-person accounting firm): “We eliminated 12 hours per week of partner coordination time in the first 30 days. The ROI was obvious.”
Financial Projections
| Year 1 | Year 2 | Year 3 | |
|---|---|---|---|
| ARR | $1.8M | $4.8M | $11.2M |
| Customers | 100 | 260 | 580 |
| Gross Margin | 82% | 84% | 85% |
| Headcount | 12 | 24 | 45 |
| Burn Multiple | 1.4x | 1.1x | 0.7x |
Key assumptions:
- Monthly growth decelerates from 18% to 12% as we move from founder-led to sales-led motion
- CAC increases from $4,200 to $6,800 as we add paid channels
- NRR improves from 110% to 125% as expansion revenue kicks in at month 12+
Use of Funds ($2.5M over 18 months)
| Category | Amount | Purpose |
|---|---|---|
| Sales (VP Sales + 2 AEs) | $980K | Reach 100 customers |
| Engineering (2 engineers) | $520K | Enterprise features + integrations |
| Customer Success (1 hire) | $180K | Reduce churn, drive expansion |
| Marketing | $420K | Content, events, partnerships |
| Operations | $400K | Infrastructure, legal, misc |
Milestone: $1.8M ARR at month 18 — the minimum viable threshold for a Series A from top-tier firms.
Sample 2: B2B Marketplace — SupplyBridge
Fictional company based on real funded marketplace patterns
Executive Summary
Company: SupplyBridge Stage: Seed Raising: $3M Current GMV: $1.2M (last 90 days) Take Rate: 8% Revenue Run Rate: $384K
SupplyBridge is a B2B marketplace connecting independent restaurant groups (10–50 locations) with regional food and beverage suppliers, replacing the fragmented mix of phone calls, email chains, and PDF catalogs that currently characterize restaurant supply procurement.
Independent restaurant groups spend 6–8 hours per week per location on procurement coordination. National chains have automated this entirely. We bring the same capability to independent operators through a marketplace that handles discovery, ordering, invoicing, and payment in one platform.
One marketplace startup showed: 2,400 registered users acquired in 6 months with zero paid marketing, 340 completed transactions totaling $180,000 GMV, 65% month-over-month growth in transaction volume, and 40% of users completing repeat transactions within 30 days. Our traction pattern mirrors this closely.
Current traction: 180 restaurant locations, 45 suppliers, $1.2M GMV last quarter, 68% of buyers completing repeat orders within 30 days.
Market Analysis
TAM: US restaurant supply market is $380 billion annually. Independent and regional operators (our focus) represent $140 billion of that market.
SAM: Independent restaurant groups with 10–50 locations, focusing on the top 30 US metros. Approximately 8,400 groups, average $2.4M annual supply spend per group: $20 billion SAM.
SOM: Year 3 target — 1,200 restaurant groups, $2.8B GMV, $224M revenue at 8% take rate.
Target customer: Independent restaurant group operator, 15–40 locations, currently managing procurement through a combination of direct supplier relationships, a part-time purchasing coordinator, and a lot of spreadsheets.
Why they switch to SupplyBridge:
- 3.2 hours per location per week saved in procurement coordination
- Average 7% cost reduction from supplier competition on the platform
- Net-30 payment terms (we finance this, suppliers get paid immediately)
Business Model
Take rate: 8% on all GMV processed through the platform Payment financing margin: 1.2% on net-30 financing provided to buyers Premium supplier listings: $299/month for enhanced visibility
Unit economics:
- Average restaurant group GMV: $185K/year
- Revenue per group: $14,800/year (8% take rate)
- CAC per group: $1,200 (trade show + outreach)
- CAC Payback: 1 month
- LTV (at 85% annual retention): $74,000
- LTV:CAC: 61x
Traction
- 180 restaurant locations across 22 groups
- 45 active suppliers covering produce, proteins, dry goods, and beverages
- $1.2M GMV in Q2 2026 (first full operational quarter)
- 68% repeat buyer rate within 30 days
- 85% supplier retention since launch
- $0 paid marketing — direct outreach and 2 industry trade shows
Financial Projections
| Year 1 | Year 2 | Year 3 | |
|---|---|---|---|
| GMV | $6M | $28M | $120M |
| Revenue (8%) | $480K | $2.24M | $9.6M |
| Gross Margin | 68% | 72% | 75% |
| Headcount | 8 | 18 | 38 |
Use of Funds ($3M over 20 months)
| Category | Amount | Purpose |
|---|---|---|
| Sales & Partnerships | $840K | 3 regional sales reps, 2 supplier partnerships managers |
| Engineering | $680K | Mobile app, supplier integrations, payment infrastructure |
| Payment Financing Capital | $900K | Fund net-30 terms for buyers |
| Operations & Marketing | $580K | Trade shows, content, customer success |
Sample 3: Vertical SaaS — BuildTrack
Fictional company based on real funded vertical software patterns
Executive Summary
Company: BuildTrack Stage: Seed Raising: $2M Current ARR: $280K Customers: 34 general contractors NRR: 118%
BuildTrack is a project financial management platform built exclusively for commercial general contractors with $5M–$50M annual revenue — a segment currently forced to use QuickBooks (built for retail businesses) or expensive enterprise platforms (built for $200M+ contractors).
Commercial general contractors manage 15–40 simultaneous subcontractor relationships per project, with payment terms, lien waivers, change orders, and compliance documentation that generic accounting software doesn’t understand. BuildTrack handles all of it natively.
We are not a horizontal accounting tool with construction templates. We are a construction-native financial platform with accounting built in.
Market Analysis
TAM: The US construction software market is $2.8 billion and growing at 10% annually.
SAM: Commercial general contractors with $5M–$50M annual revenue: approximately 24,000 firms in the US, average $8,400/year software spend per firm: $201M SAM.
Target customer: Commercial GC, $8–30M revenue, 8–25 employees, currently using QuickBooks + Excel + email for project financial management. Frustrated by the manual reconciliation required every month.
Why now: Investors are particularly bullish on vertical AI SaaS solutions that apply machine learning to specific industry problems. Notable vertical SaaS categories attracting substantial funding include construction technology. The timing is right for a construction-native financial platform that incumbents have left underserved.
Business Model
| Tier | Price | Features |
|---|---|---|
| Core | $499/month | Up to 10 active projects |
| Growth | $899/month | Unlimited projects, subcontractor portal |
| Scale | $1,499/month | Multi-entity, advanced reporting |
Unit economics:
- ACV: $8,400
- CAC: $2,100 (construction trade associations + referrals)
- CAC Payback: 3 months
- Gross Margin: 79%
- NRR: 118% (expansion from additional projects and modules)
- LTV: $56,000 (at 85% retention + expansion)
Traction
- 34 paying customers in 11 months
- $280K ARR ($23.3K MRR)
- 118% NRR — expansion from existing customers
- Zero churn in first 11 months (0 of 34 customers cancelled)
- 8 referrals from existing customers — primary acquisition channel
- 2 construction trade association partnerships generating warm leads
Financial Projections
| Year 1 | Year 2 | Year 3 | |
|---|---|---|---|
| ARR | $980K | $2.8M | $6.4M |
| Customers | 110 | 290 | 620 |
| NRR | 118% | 122% | 125% |
| Gross Margin | 79% | 81% | 83% |
| Headcount | 9 | 18 | 35 |
Use of Funds ($2M over 18 months)
| Category | Amount | Purpose |
|---|---|---|
| Engineering (2 hires) | $680K | Subcontractor portal, mobile app, integrations |
| Sales (1 AE + 1 SDR) | $420K | Scale from 34 to 110 customers |
| Customer Success | $180K | Drive NRR from 118% to 125% |
| Marketing & Partnerships | $320K | Association partnerships, content, trade shows |
| Operations | $400K | Infrastructure, legal, finance |
Key Lessons Across All Three Samples
1. Open with a specific problem, not a vision statement. All three plans open with a concrete, quantified problem — hours wasted, costs incurred, workflows broken. Vague mission statements (“we are transforming X industry”) signal that the founder hasn’t done enough customer research.
2. Show the unit economics before you show the projections. Investors check unit economics first. If your LTV:CAC is below 3x or your payback period exceeds 18 months, no growth projection will save you. All three samples show LTV:CAC above 15x — which is the kind of efficiency that gets investors excited about the model before they evaluate the market.
3. Be specific about traction, not just impressive. Include your current traction with the most impressive metrics you have. Even at seed stage, investors want evidence that customers want what you are building. “Growing fast” is not traction. “18% MoM growth, 94% logo retention, $0 paid marketing” is traction.
4. Connect every dollar to a specific milestone. The use of funds section should not be a budget. It should be a logic chain: “We are raising $2.5M to hire VP Sales and 2 AEs, which will get us to 100 customers, which will get us to $1.8M ARR, which is the minimum viable threshold for a Series A from top-tier firms.”
5. Be honest about what you don’t know. Analyze competitors honestly, including both direct competitors and alternative solutions. Show what each competitor does well, where they fall short, and why customers would choose your solution. Founders who claim they have no competition signal they haven’t done their homework. Every funded business plan in 2026 includes a candid competitive section.
Read More: Georgia Tech Startup Investment Climate 2026
The Structure Every 2026 Business Plan Should Follow
Based on what secured seed funding in 2026:
- Executive Summary (2-3 pages) — Problem, solution, traction, ask
- Market Analysis (4-6 pages) — TAM/SAM/SOM, customer profile, competitive landscape
- Product (3-4 pages) — What it does, how it works, roadmap
- Business Model (2-3 pages) — Revenue model, unit economics, pricing
- Traction (2-3 pages) — Metrics, customer quotes, growth charts
- Go-to-Market (3-4 pages) — Acquisition channels, sales motion, partnerships
- Team (2-3 pages) — Why this team, relevant experience, gaps you know about
- Financial Projections (4-5 pages) — 3-year model, key assumptions, scenarios
- Use of Funds (1-2 pages) — Specific allocations tied to specific milestones
Total: 27–36 pages. In 2026, startups that raised seed rounds used a comprehensive 42-page business plan structure that addressed every question investors ask during diligence while telling a compelling story about market opportunity and team capability.